Departure boards riders can trust.
A frozen “2 min” is worse than no display at all. Every design decision in our display stack starts from that failure mode — and prevents it.
In plain language
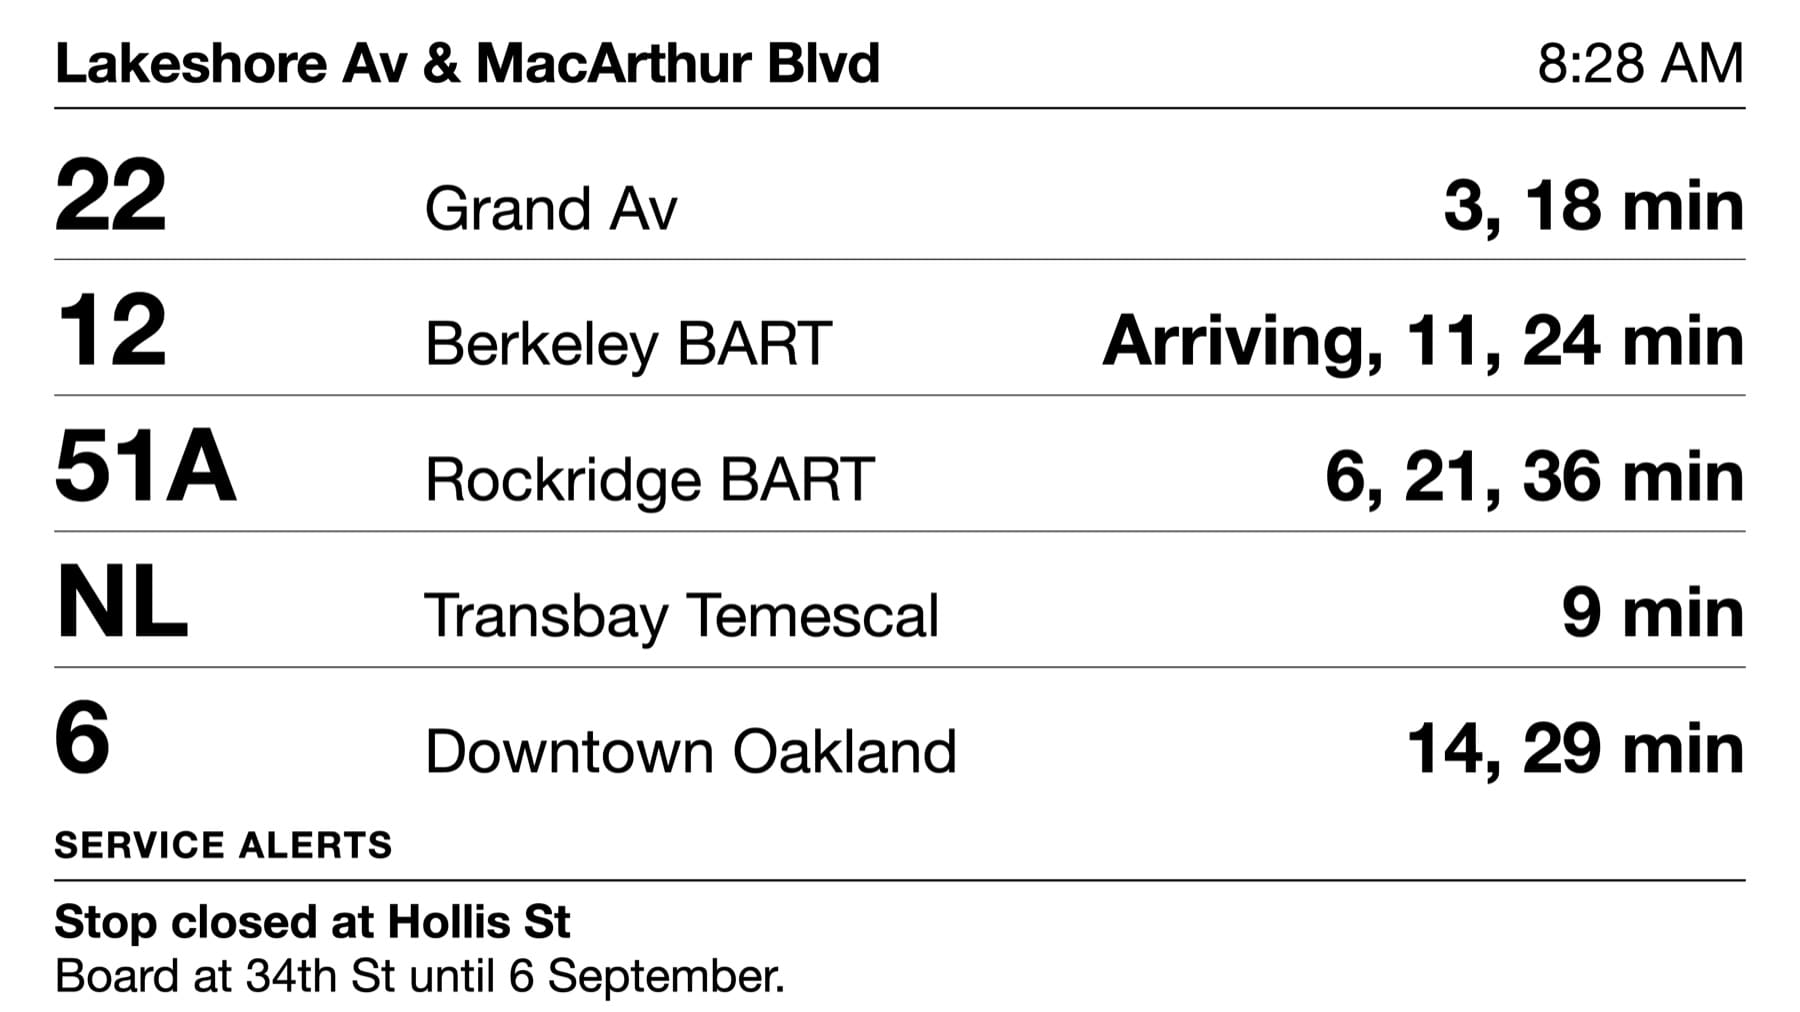
A display is a screen that shows when the next bus or train will come.
This software draws those screens from your own feed.
You pick which stop or route each screen shows. The screens then update on their own.
They run on cheap hardware. They also run on screens that use very little power.
From a single stop to the whole network
Address a display at any level of your system: a single stop, a route, several entities at once, an agency, or the whole network. Each display is a small config entity you can deploy through version control, or spin up ad hoc from a URL.
- Stop displays — shelter screens and platform boards
- Route & system boards — operations rooms, transit centers
- Variants as skins — LCD, e‑ink, mobile, or your own via a hook
- Multi-screen surfaces — one stop across two coordinated panels, page-flipping in lockstep
# A saved, deployable display
/gtfs/display/{context}

# Ad hoc: any GTFS entity, straight from the URL
/gtfs/display/stops/4021
/gtfs/display/routes/17

# Two screens, one stop, synchronized paging
/gtfs/display/stops/4021/pd1/top
/gtfs/display/stops/4021/pd1/bottom
When the data goes stale, the display says so.
Connectivity in the field fails — cellular modems drop, backhauls flap, feeds hiccup. What matters is what the screen does next.
- Staleness banner — after a couple of missed polls, riders see “Updated X min ago” — never a frozen “2 min.”
- Graceful degradation — after minutes offline, live countdowns are withdrawn and scheduled times take over, clearly labeled.
- Offline shell — a service worker keeps the display booting and rendering through outages, with last-known-good data from local storage.
Runs for years on the kiosk you already own.
Field hardware is old, underpowered, and rarely rebooted. The display frontend is a dependency-free vanilla JavaScript micro-app — no framework, no runtime dependencies — compiled to a single small bundle with flat CSS.
- Low memory, low CPU — DOM updates are diffed and keyed; no virtual-DOM churn.
- Lockstep paging — page rotation is derived from the clock with skew correction, so banks of screens flip together.
- Backoff & jitter — polite polling that recovers smoothly and never stampedes your API.
Tools for the operations team
- Annotations & overrides — pin a note to a stop (“Board across the street this weekend”) or redirect predictions to a temporary stop, scheduled by time windows.
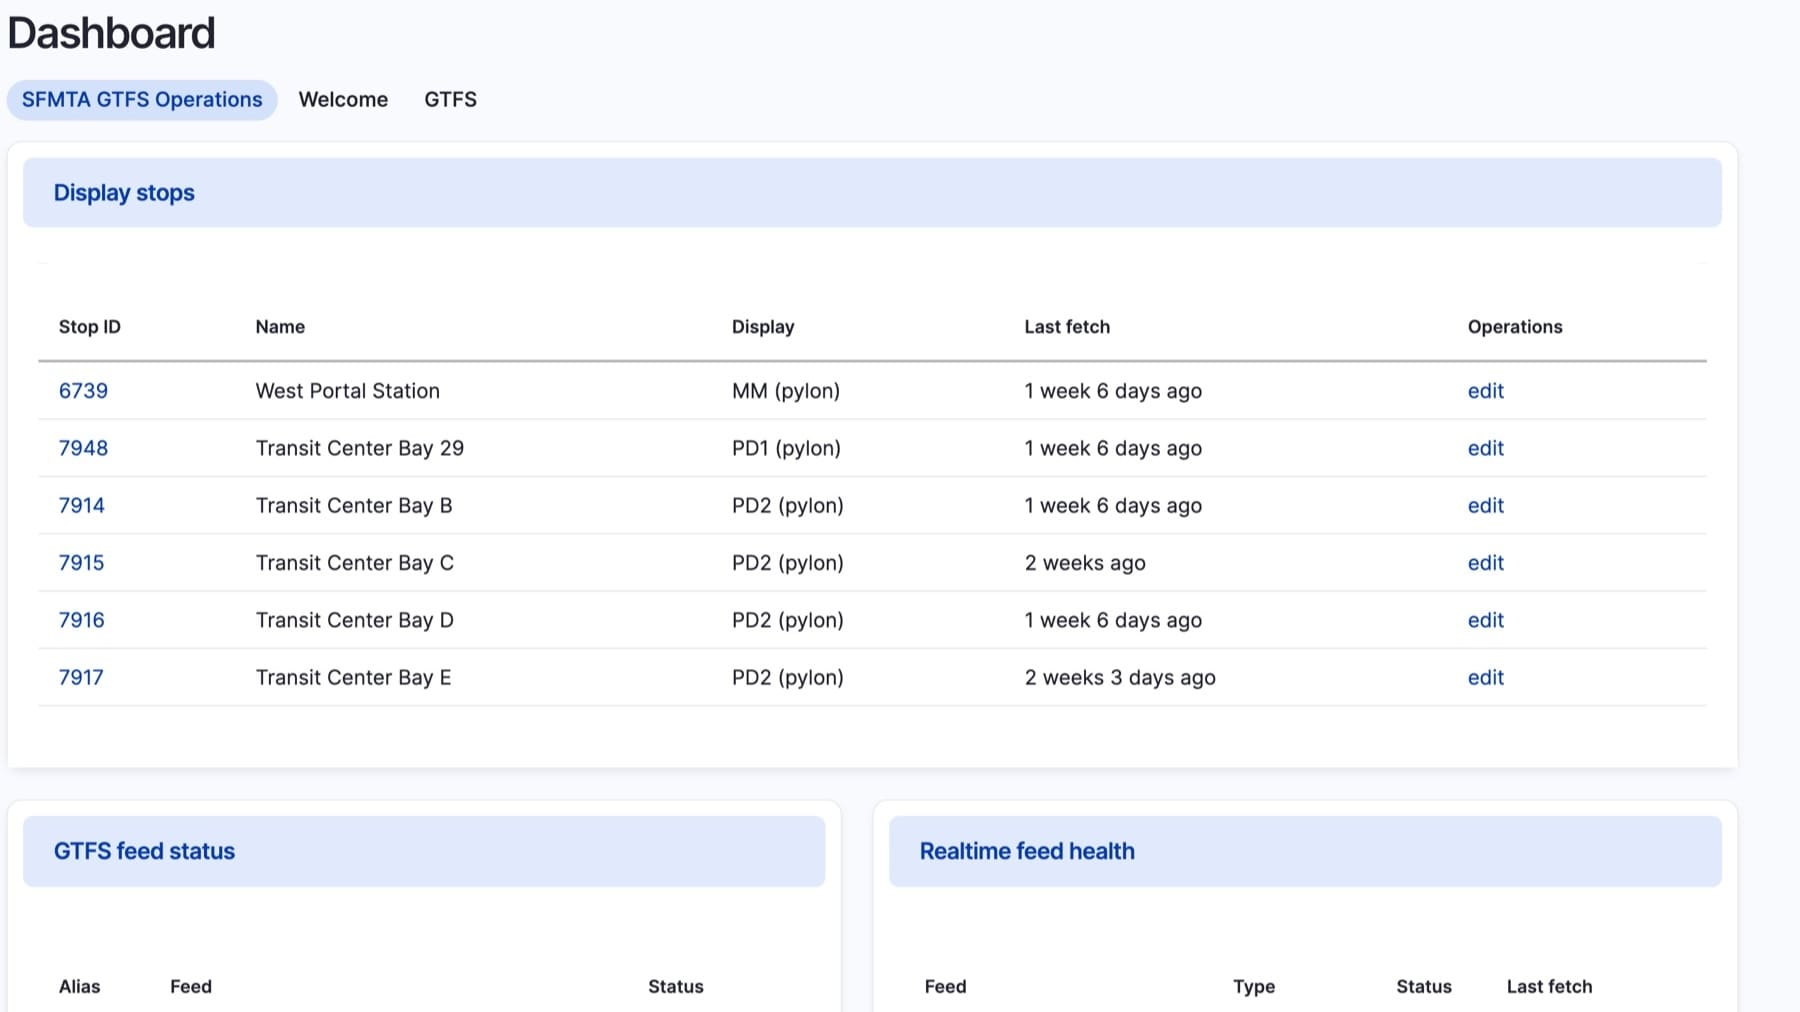
- Fleet telemetry — every display phones home with heartbeats and error events; last-seen tracking shows you what's dark before riders do.
- Per-display permissions — public kiosks get exactly the access they need, nothing more.
- Technician debug overlay — permission-gated diagnostics on the device itself: live state, data freshness, region boundaries.
Put your feed to work.
Bring your feed and your hardware inventory — we'll bring the software that keeps them honest.